Scaling a Packaging Brand on Amazon

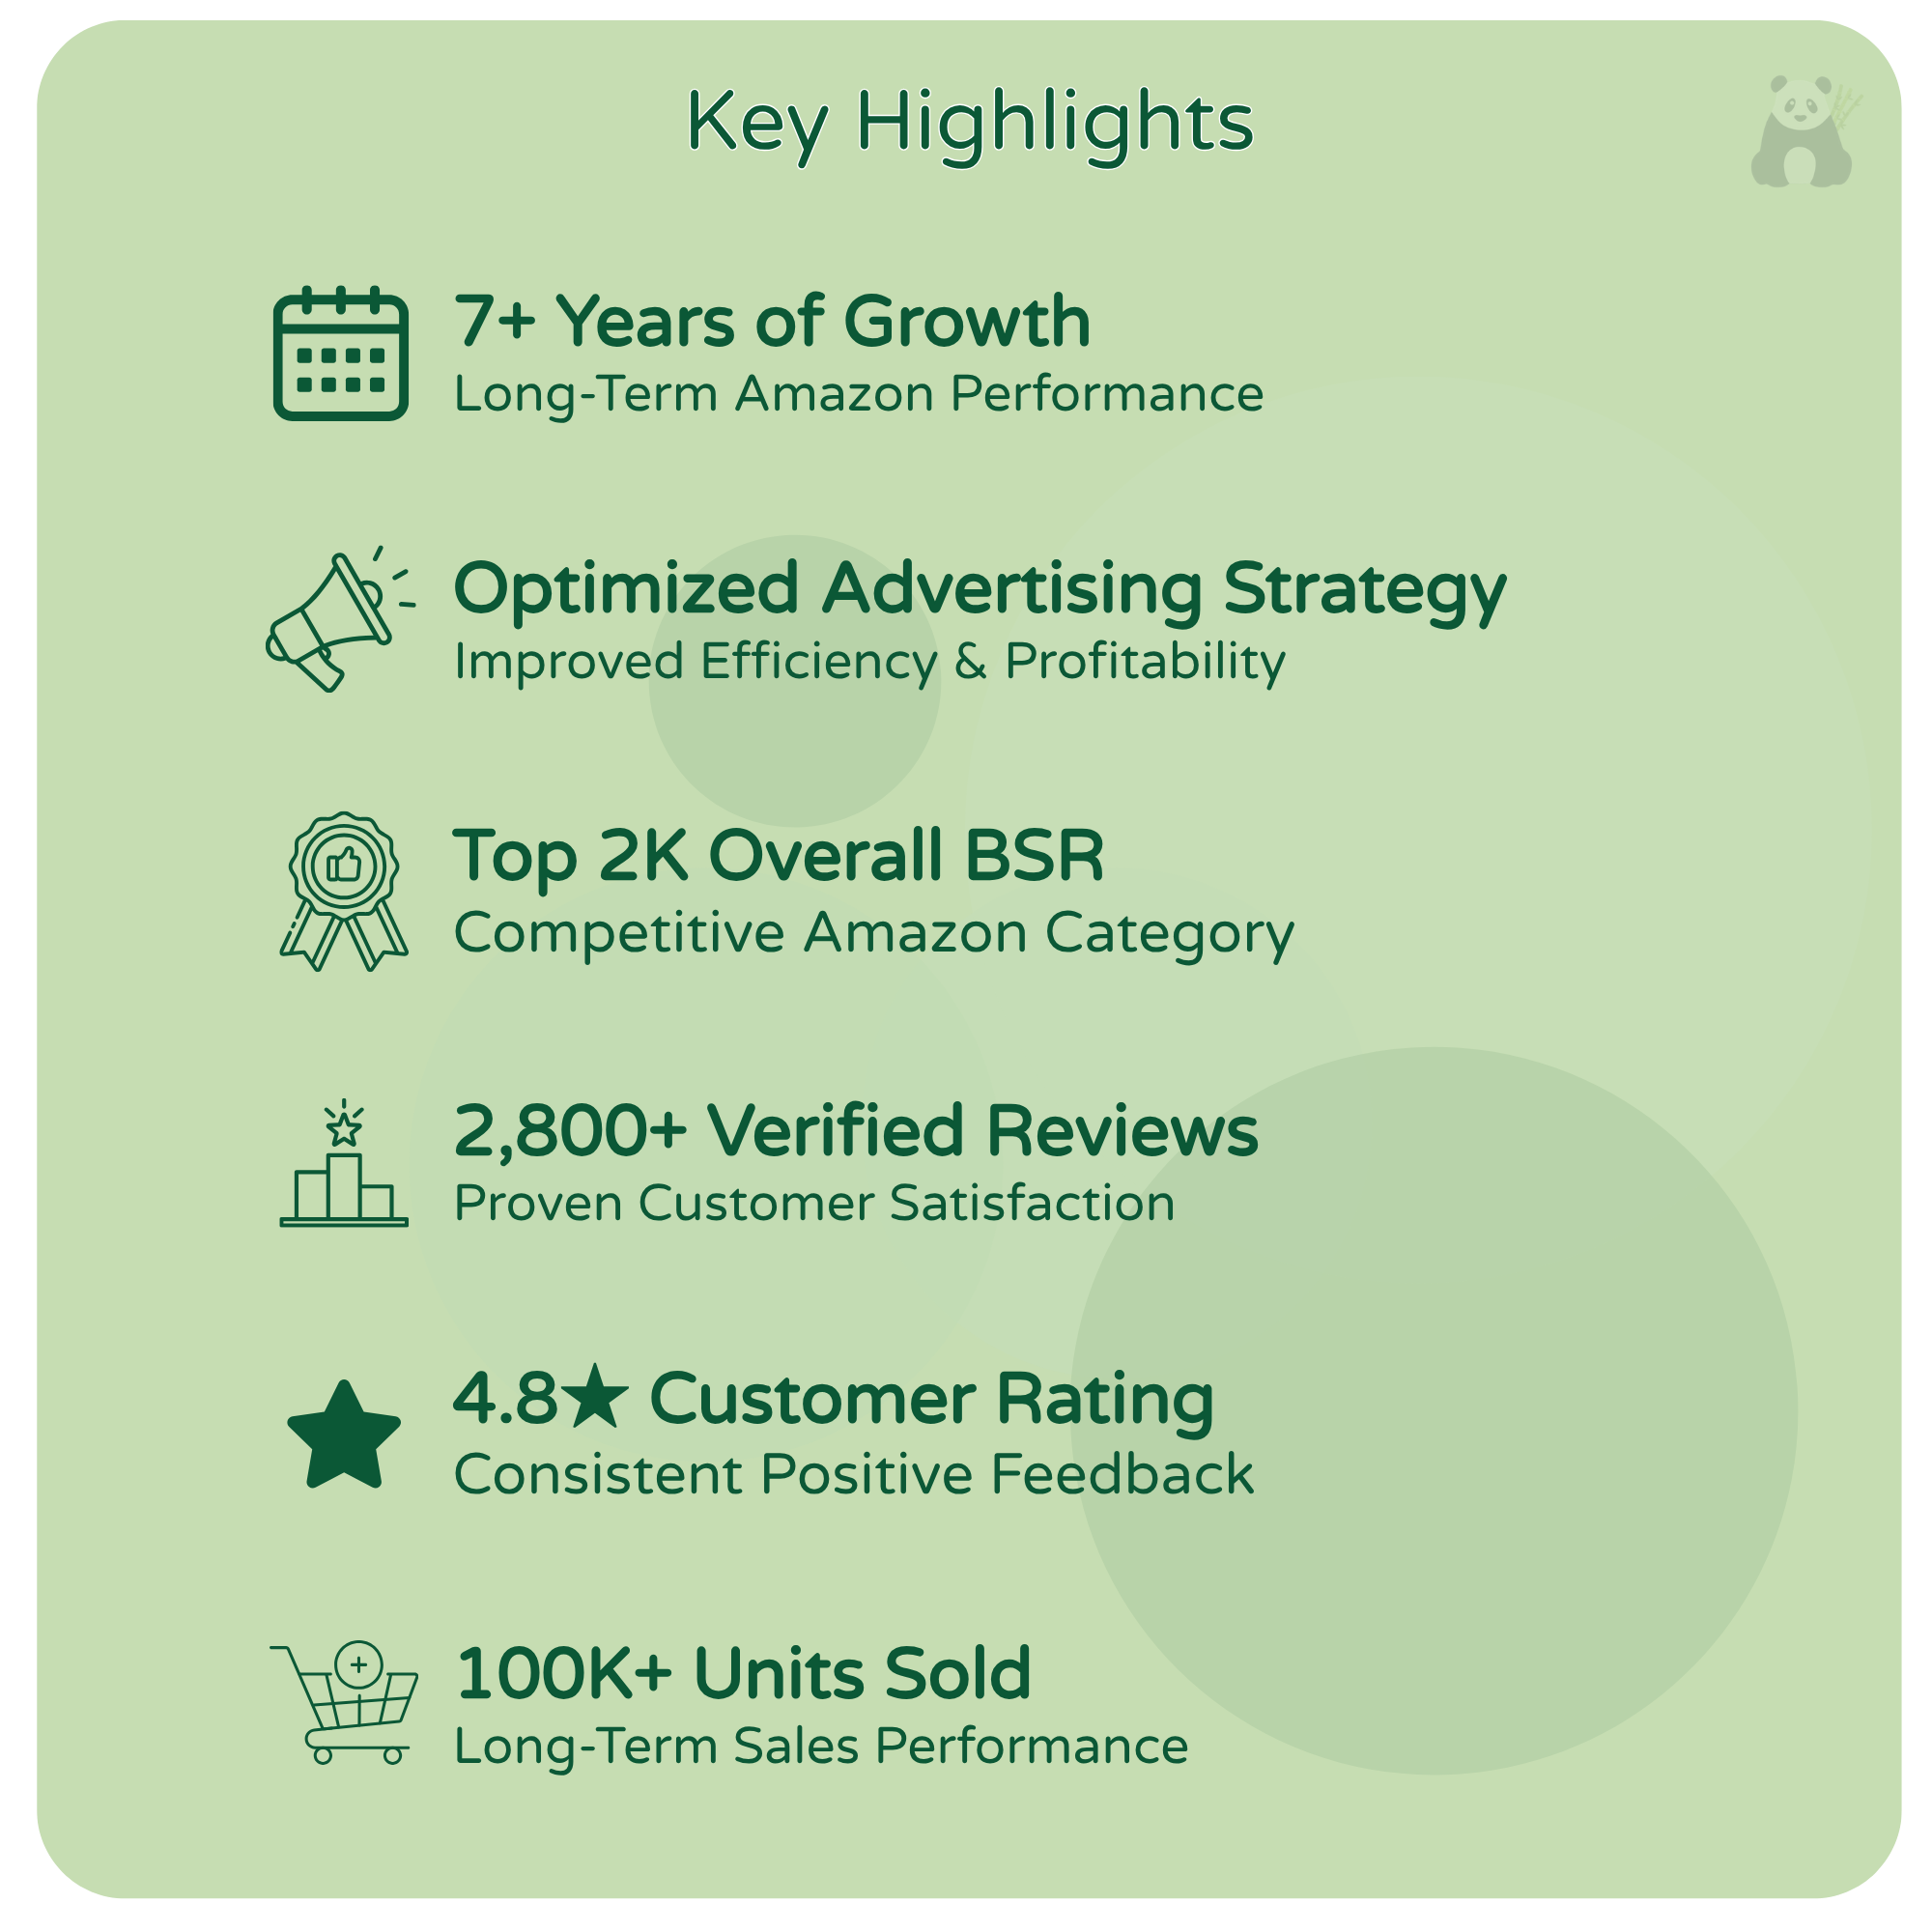
7+ Years of Performance-Driven Growth

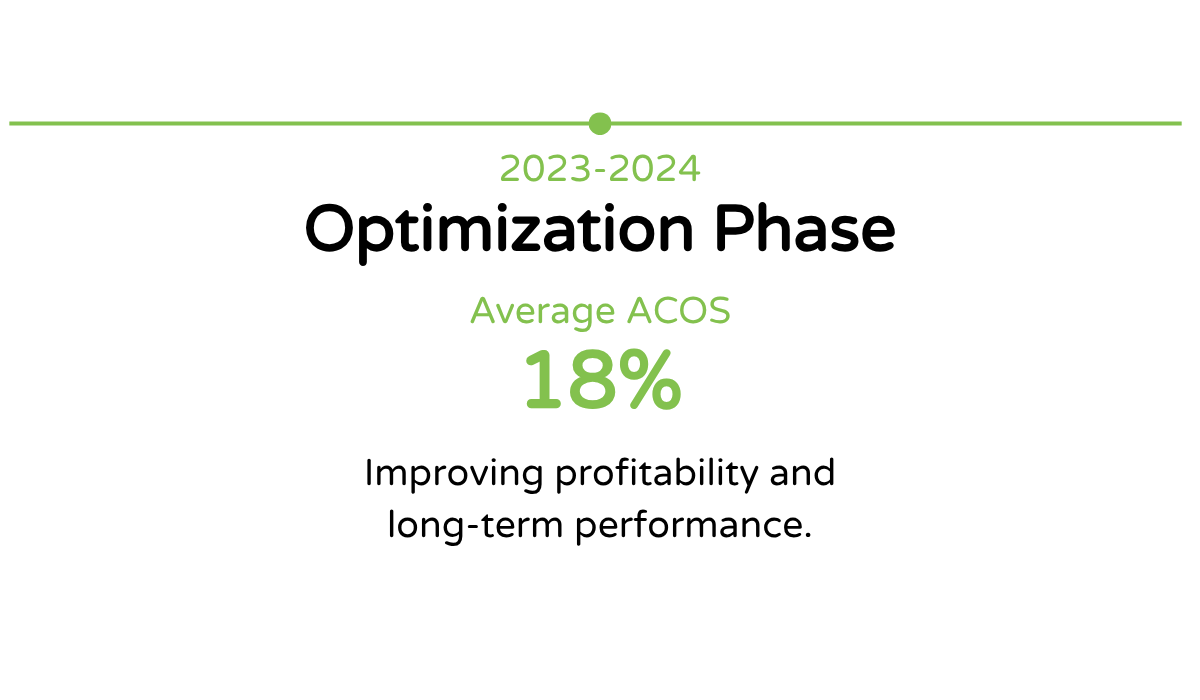
Strategic Amazon advertising focused on improving profitability, reducing ACOS, and driving long-term revenue growth.

Amazon PPC Amazon KDP Book advertising Amazon advertising Amazon AMC PPC strategy Kindle Ads Amazon Ads amazon expertise amazon agency digital marketing agency
A presentation slide with the title 'The Challenge'. It discusses launching a new product on Amazon while building visibility, generating sales, and maintaining advertising performance. The slide lists four bullet points: build visibility, generate sales, improve conversion, and maintain efficient ACOS during launch.
Amazon PPC Amazon KDP Book advertising Amazon advertising Amazon AMC PPC strategy Kindle Ads Amazon Ads amazon expertise amazon agency digital marketing agency
A promotional graphic with the headline "Ready to Improve Your Amazon Ads?" and a photo of a man with dark hair and a beard, wearing a dark green shirt, arms crossed, smiling, with a gray background. There is text encouraging Amazon PPC Amazon KDP Bo
Line graph showing ACOS percentages from 2018 to 2019, with an average ACOS of 54% in 2018-2019.
A pie chart illustrating the average ACOS for the year 2023-2024, which is 18%, with the background mainly in black and green highlights.
Infographic showing data from 2025-2026 with an average ACOS of 28% in purple text.
Infographic showing increase in ACOS from 20% to 36% between 2020 and 2023, with a timeline at the top.
Screenshot of a table titled 'All-Time Campaign Results' showing metrics like clicks, CTR, total cost, CPC, purchases, sales, ACOS, and ROAS for multiple advertising campaigns.

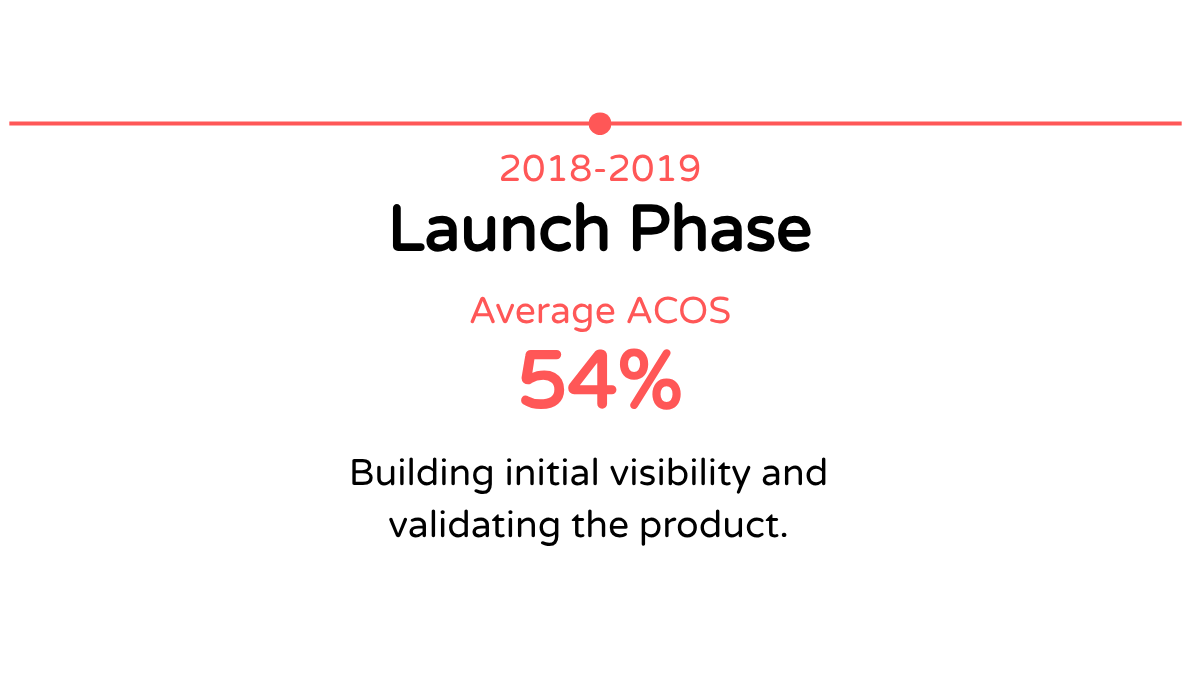
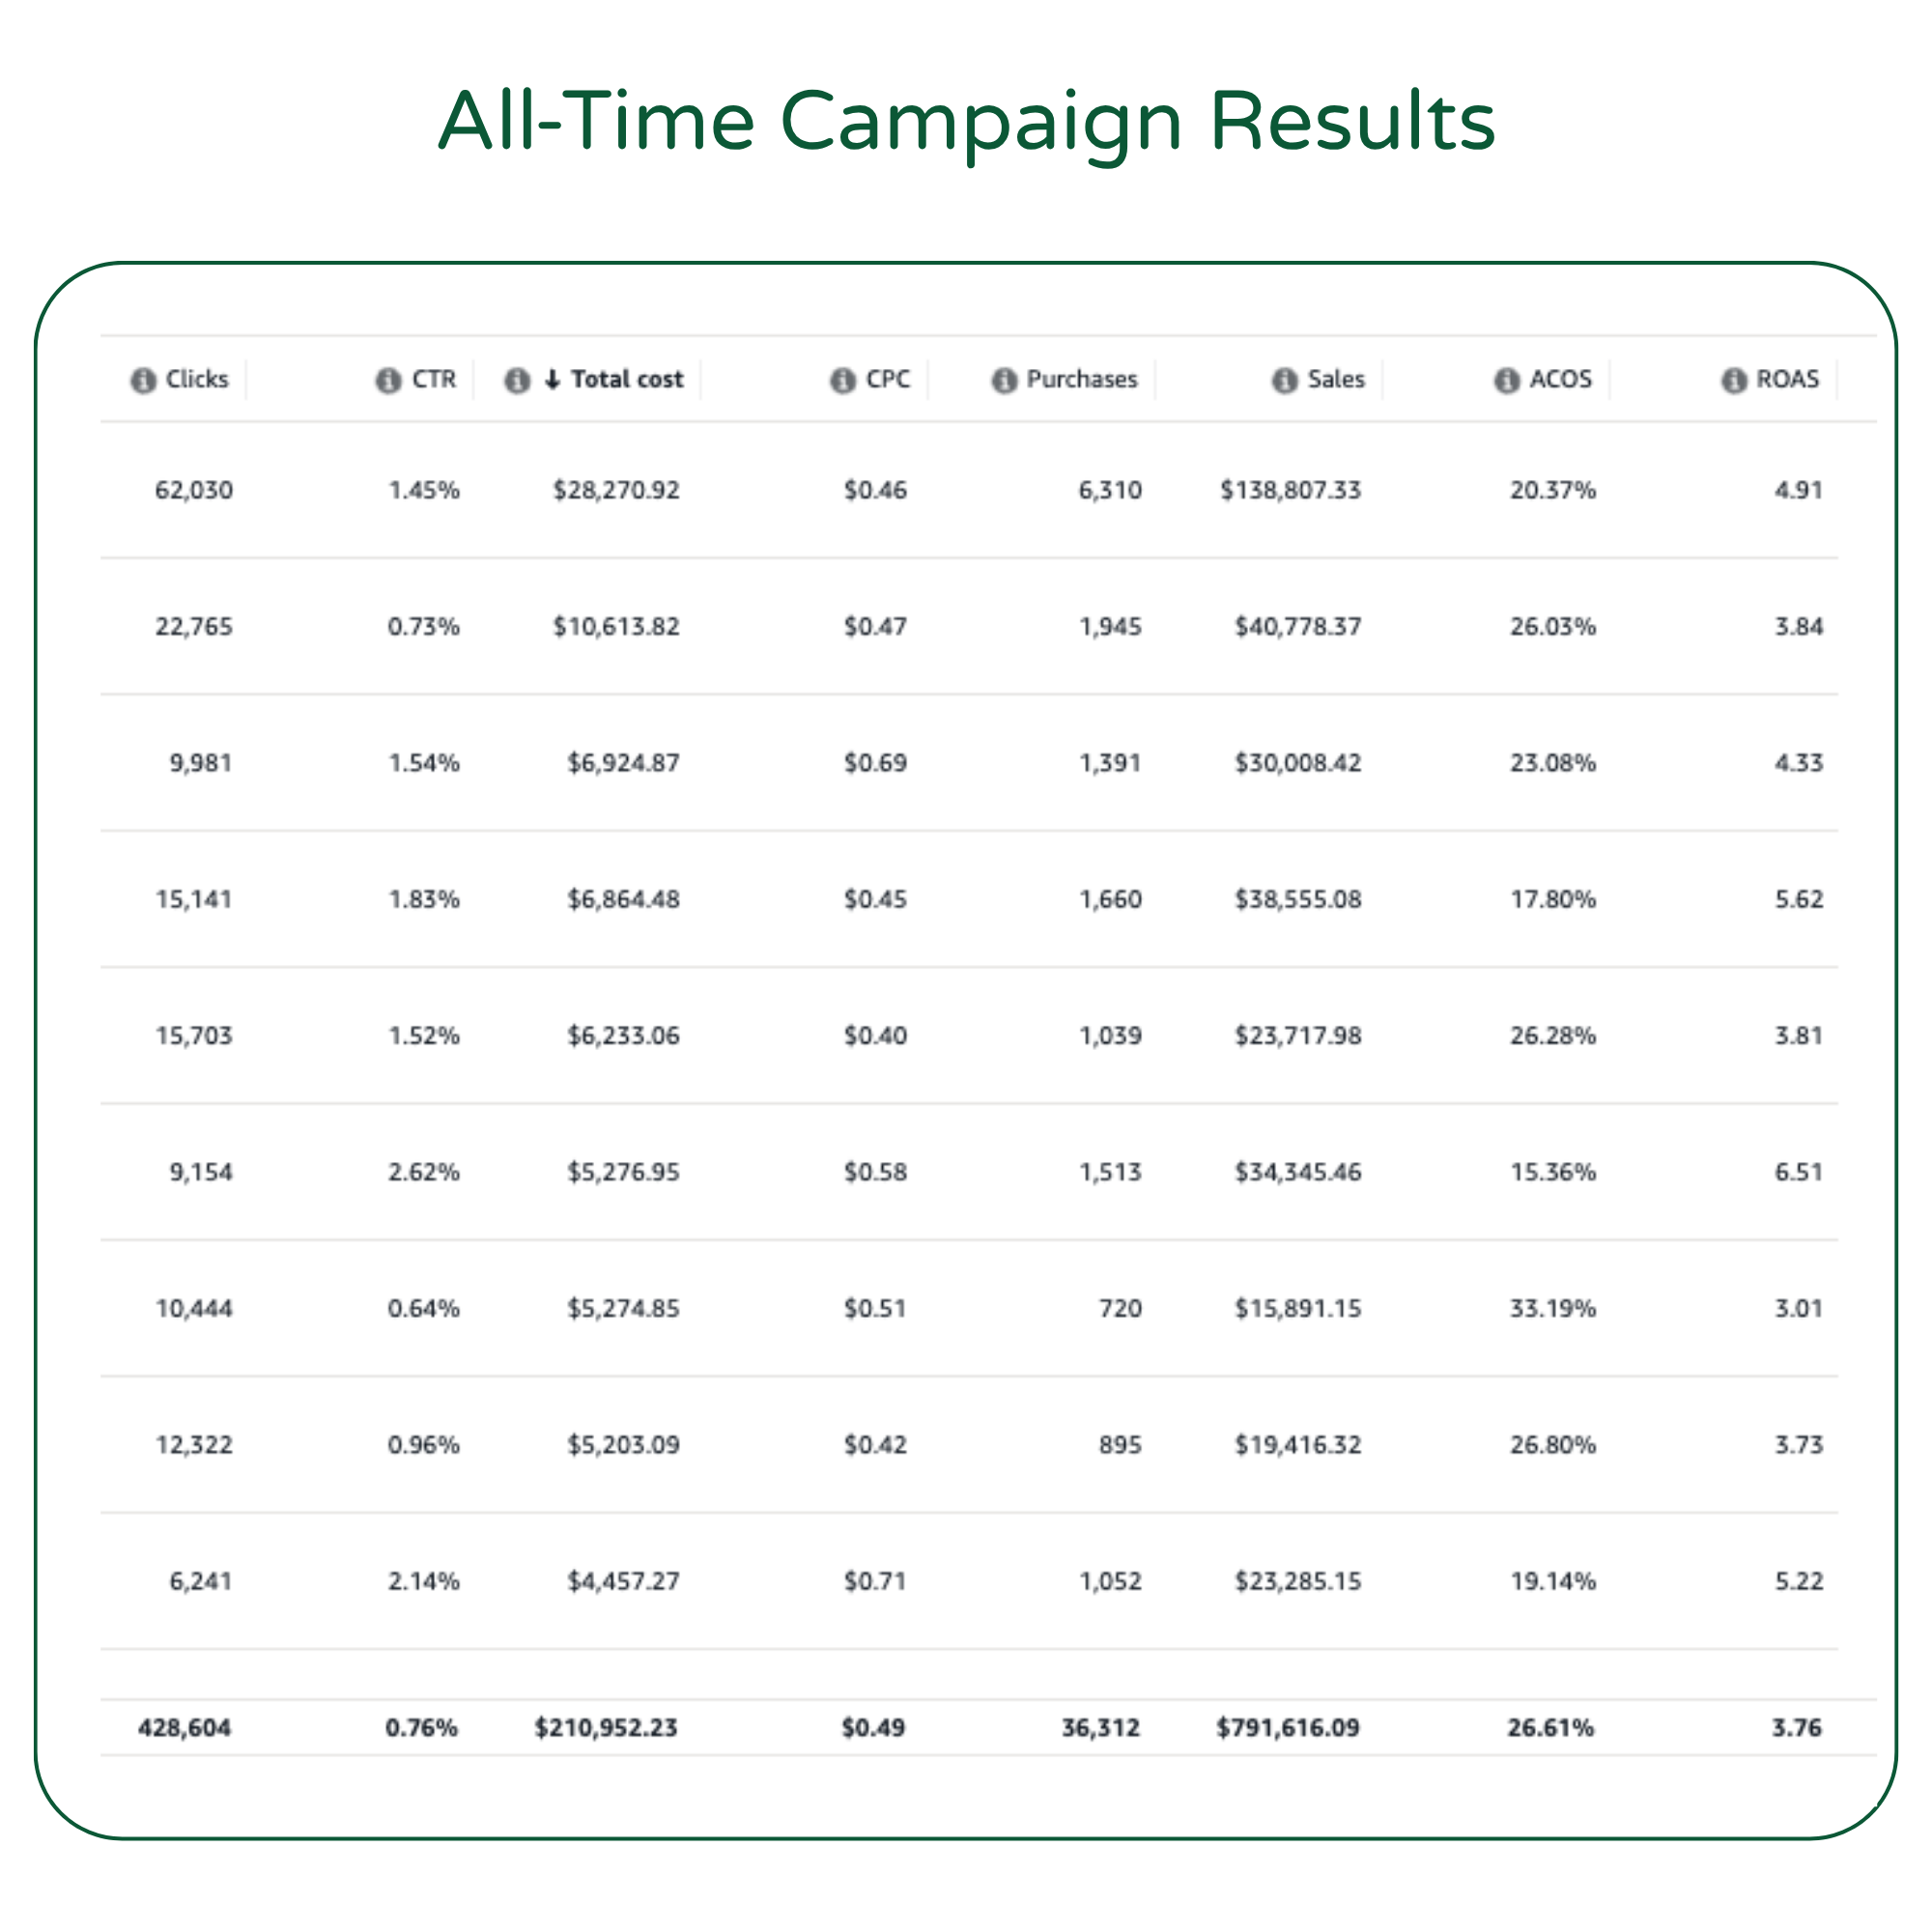
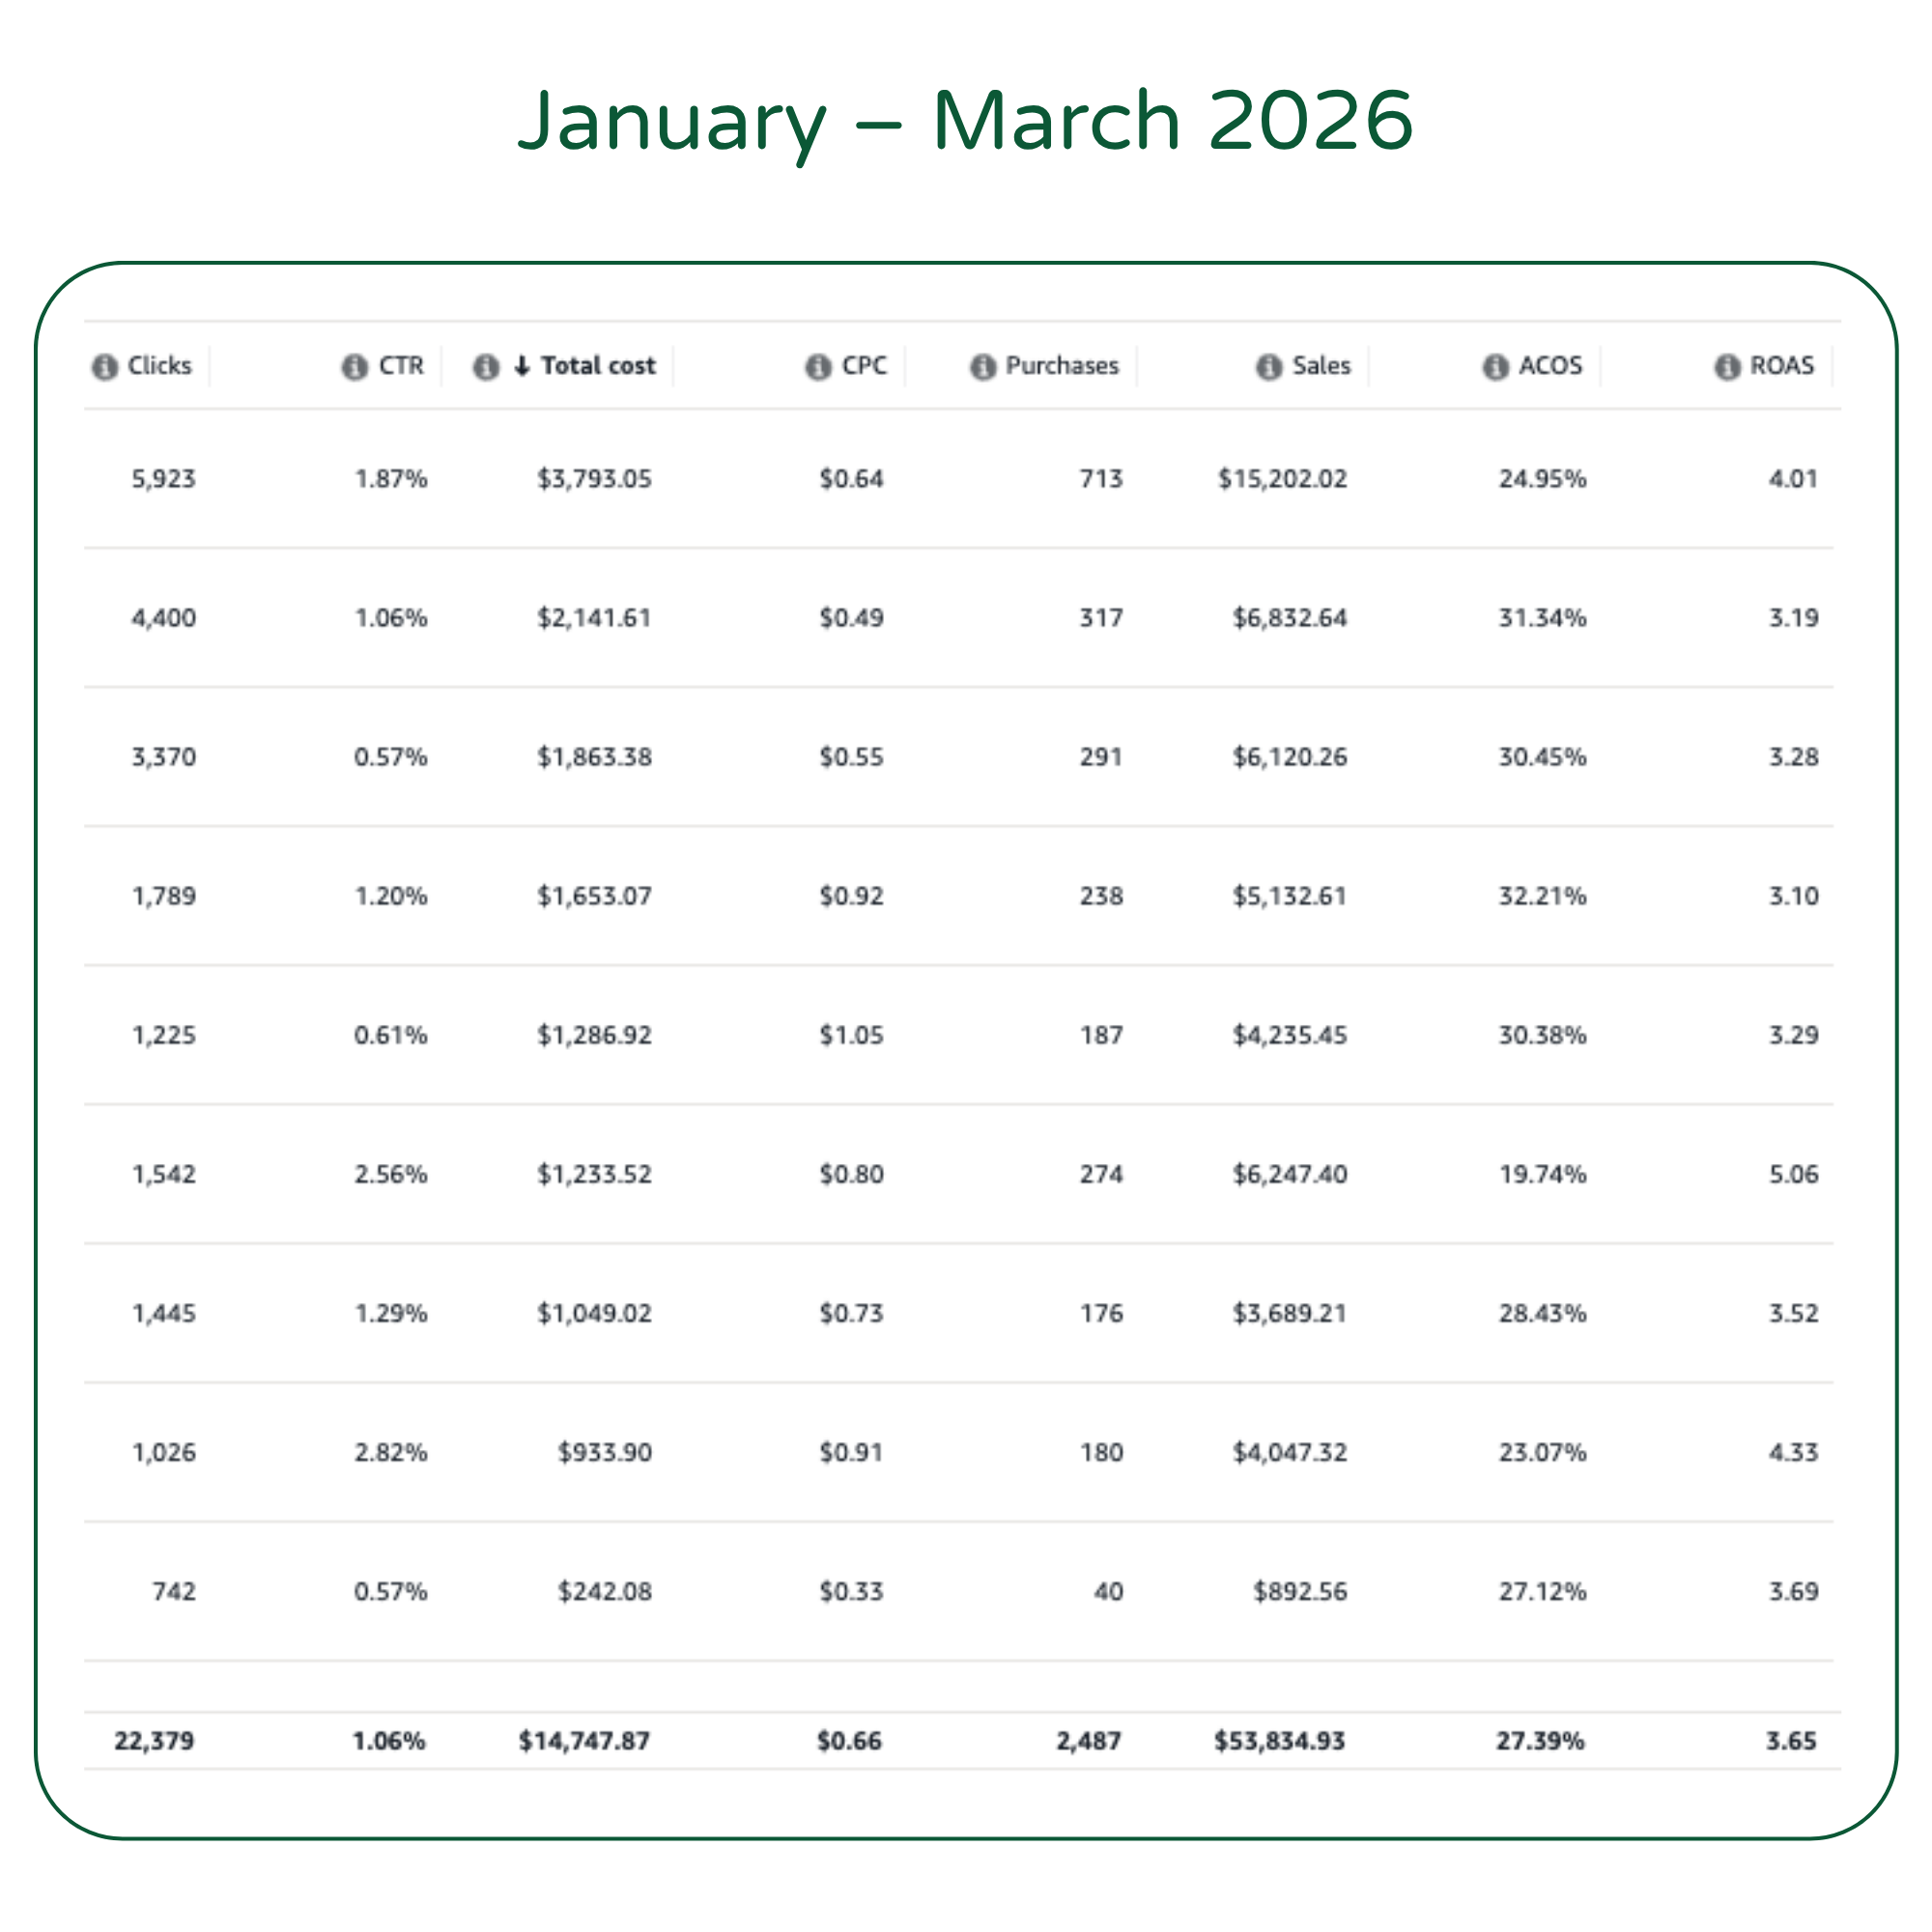
Campaign Performance Overview

Key Highlights: 7+ Years of Growth, Improved Advertising Strategy, 2,800+ Verified Reviews, 4.8 Customer Rating, 100K+ Units Sold.
Screenshot of a table showing marketing data for January to March 2026, including metrics such as clicks, CTR, total cost, CPC, purchases, sales, ACOS, and ROAS for multiple entries.
Financial infographic showing revenue and costs over two periods, with color legends for purchases, total cost, and sales, and financial figures in USD.
Flowchart comparing ACOS performance metrics, including PPC costs, sales, ACOS, and advertising costs over time.